Projects
Backtests, theses, and analyses — written slow, cited, meant to hold up.
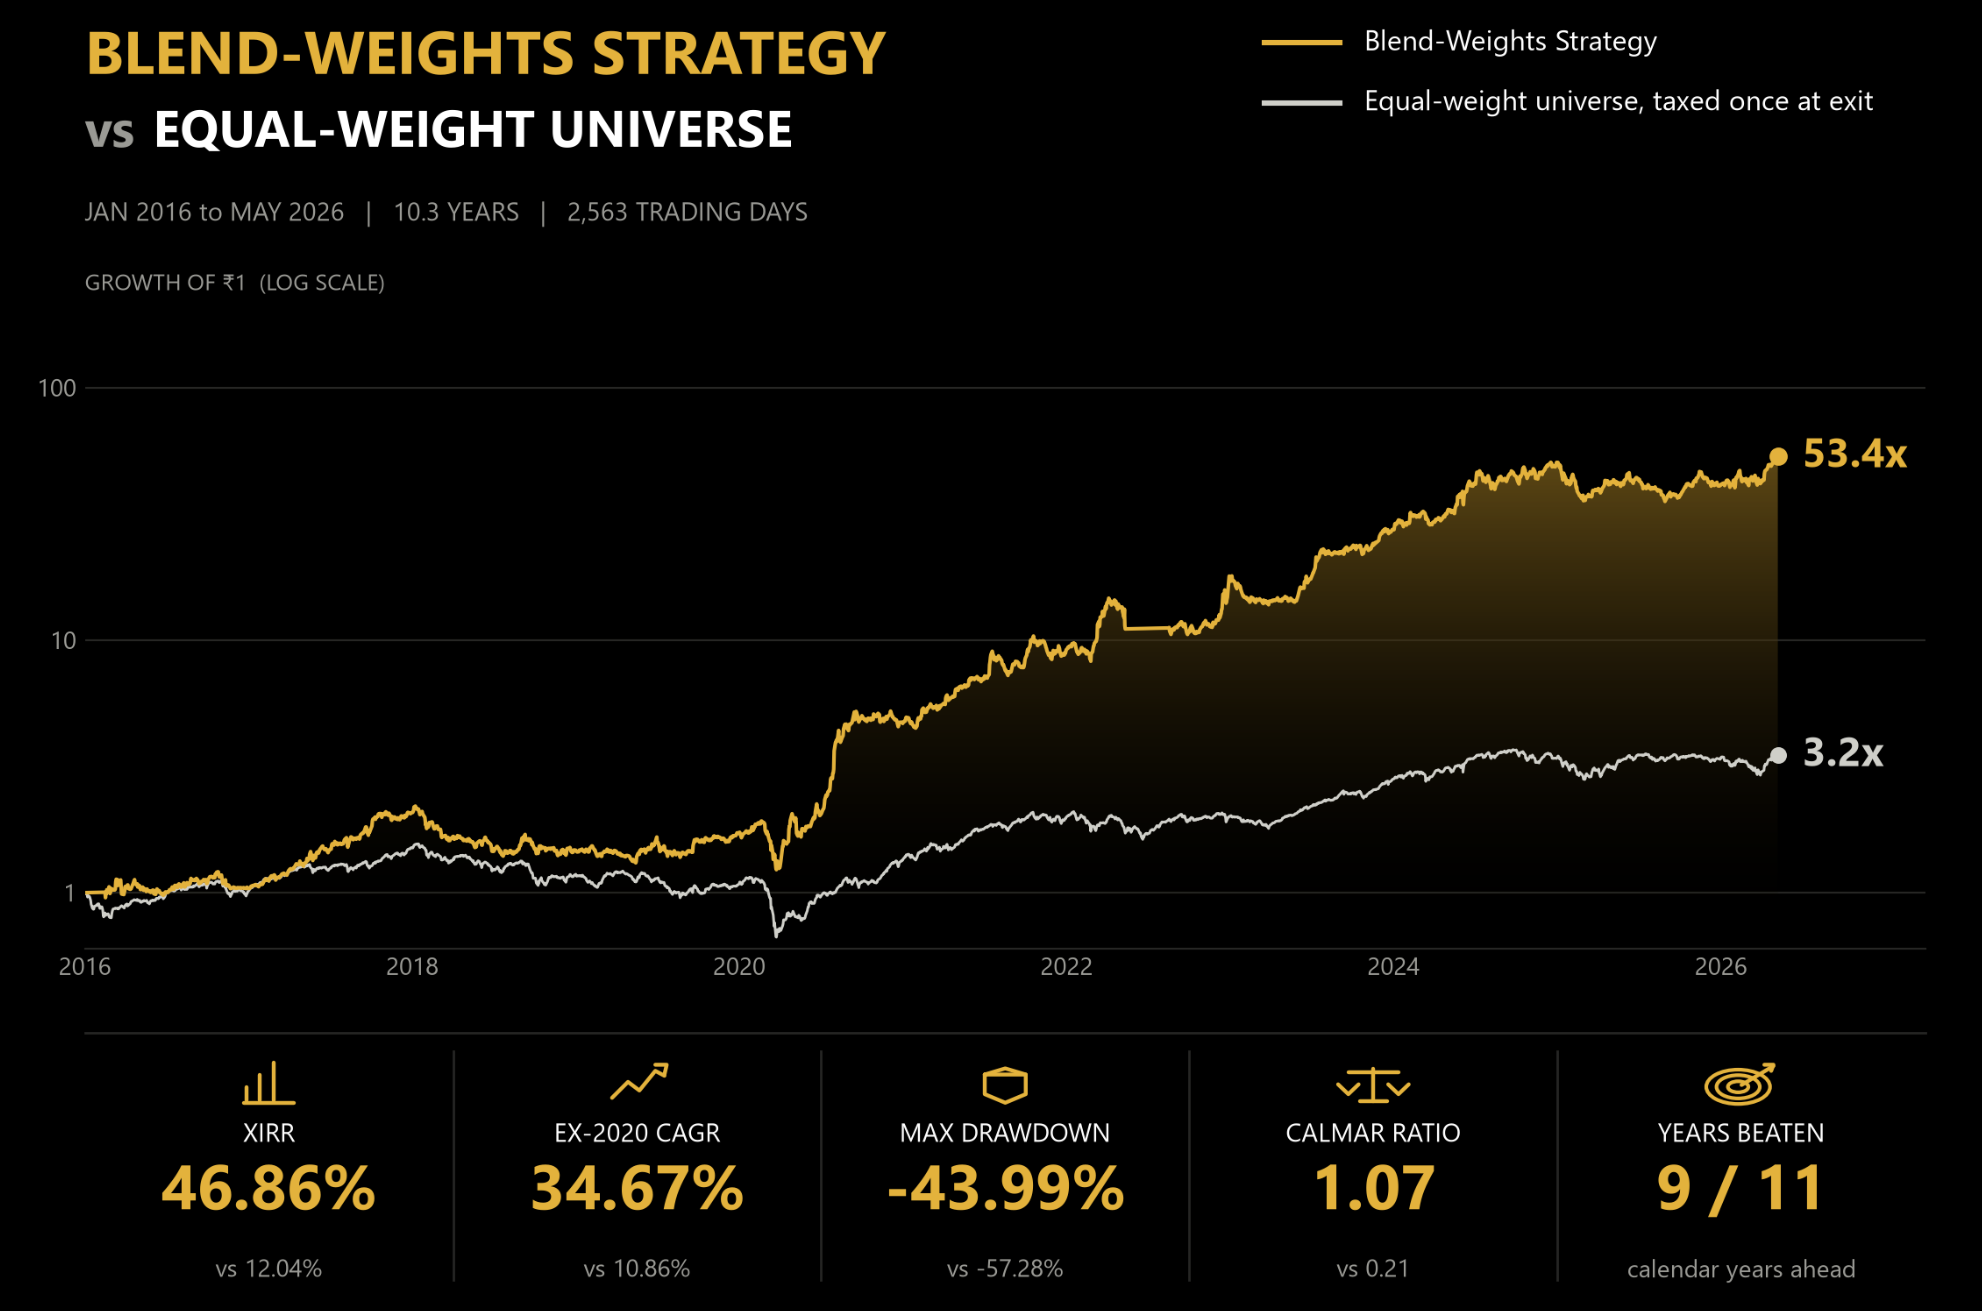
Blending Fundamentals Cross Sectionally With Technicals All Into One Score: Generating 46% CAGR over 10 years
46.86% XIRR against a 12.04% benchmark, or ₹10 lakh turned into ₹5.34 crore. 96.2% of 25,920 combinations beat that benchmark. Neither thing this test was built to find is why. Unequal weights lost 0.79 points of median XIRR across 23,328 matched pairs, and a magnitude-preserving score lost 0.83 across 12,960.
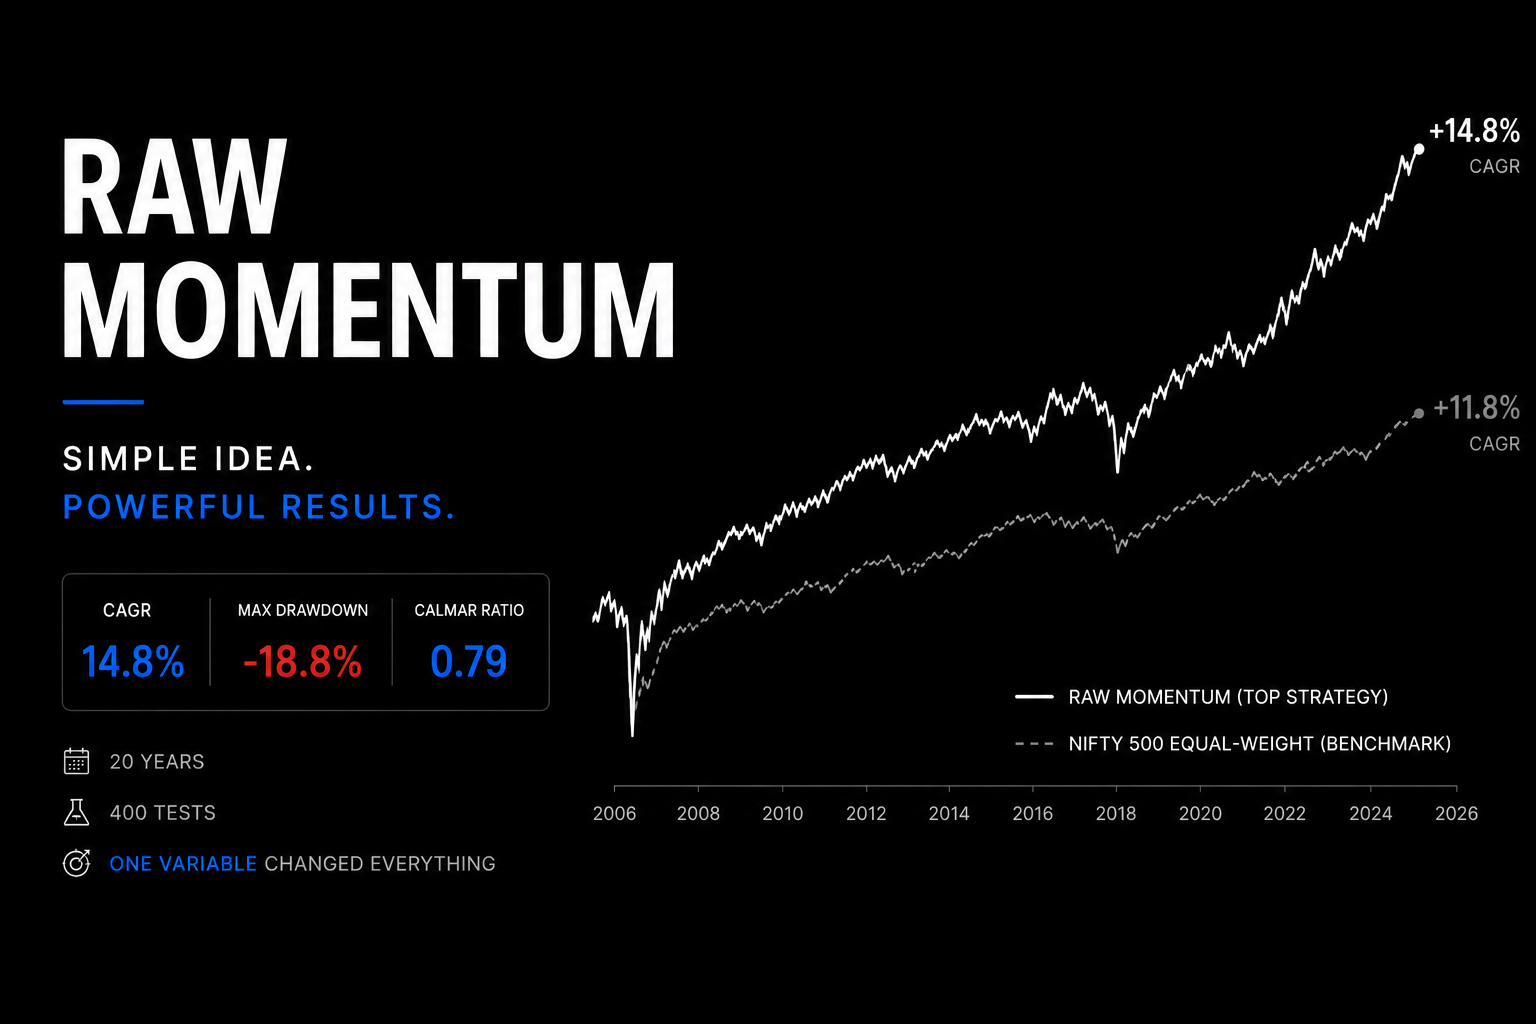
We Ran 400 Momentum Tests on Nifty 500 Stocks Across 20 Years. One Parameter Matters More Than Everything Else.
Raw price momentum was tested on the full Nifty 500 universe from 2006 to 2026. Four hundred combinations across portfolio size, lookback window, rebalancing frequency, and trailing stop-loss. The single variable that dominated every other was rebalancing frequency. Weekly rebalancing produced an average CAGR of -1.87% across 80 combinations. 12M rebalancing produced 12.44%. The signal is the same in both cases. The only thing that changes is how often you trade it.

Buying Nifty After It Falls: 152 Tests Across 30 Years Show the Same Thing
Over 30 years of Nifty data, 152 backtests examined whether buying intraday dips or overnight gap-downs could outperform a simple SIP. Different thresholds, execution rules, and fallback mechanisms were tested and every variation underperformed the SIP benchmark.
Buy the Breakout on Nifty: Why Monthly Momentum Works and Weekly Momentum Doesn't
Four momentum and draw-up strategies tested across 87 variants. Strategy 14's single 12-1 momentum rule outperforms by ₹4.34 lakh. Monthly draw-up produces 14 outperforming thresholds. Weekly draw-up and ATH breakout go a combined 0 for 50. Momentum timing on Nifty works monthly, not weekly or intraday.
Buying the Dip on Nifty: Weekly, Monthly, and ATH Drawdown Strategies vs the SIP
The reference point for "how far has Nifty fallen" matters more than the threshold you choose. ATH drawdown produces 31 outperforming thresholds out of 36. Monthly produces 18 out of 39. Weekly produces 4 out of 39 — and its worst case destroys ₹2.42 crore against SIP.
PE-Based SIP Timing on Nifty: Same Signal, Three Implementations, Three Different Outcomes
Three PE-based deployment strategies tested: PE zone switching, PE moving average ratio, and PE percentile continuous allocation. Strategy 10 beats SIP by up to ₹10.27 lakh. Strategy 11 beats SIP by up to ₹3.07 lakh. Strategy 16 goes 0 for 48. Valuation timing works until it becomes too precise.
The 200 DMA Golden Cross on Nifty: Confirmed Too Late to Matter
The 50/200 DMA golden cross fires 238 times over 30 years and trails SIP by ₹1.03 lakh. A trend filter that waits for confirmation hands back more in missed compounding than it earns in better entry prices.

Buying Nifty Strength: Intraday Breakouts and Overnight Gap-Ups vs the SIP
Four of 38 thresholds produce positive returns over the SIP across intraday breakout and overnight gap-up strategies. The best result adds ₹1.97 lakh over 30 years which is pretty much insignificant. The worst destroys ₹1.05 crore against SIP.

Buying Nifty Weakness: Intraday Dips and Overnight Gap-Downs vs the SIP
Both strategies lose. Across 30+ years of daily Nifty data and 19 thresholds each, buying intraday dips or overnight gap-downs never outperforms a monthly SIP. The worst interday gap-down variant, a 4% filter, trails the SIP by ₹1.47 crore on ₹36.7 lakh of contributions.